![]()
James E. Kelley, Jr. (1992) has made a convincing and still unrefuted argument about the population of San Salvador: working from Columbus's own report of the number and sizes of native canoes that visited his fleet on October 13, 1492, Kelley determined that the minimum population of San Salvador must lie between 634 and 1115.
More recently, Alejandro Perez (1995) has made another convincing argument about the population of San Salvador: working from Columbus's report (unnoticed by many) that the entire population could be subjugated by 50 men, Perez argues that this description suggests a population for San Salvador in the hundreds, but not in the thousands. Perez reasonably suggests a maximum population range of 500 to 1000 on that basis.
When two scholars -- advocating different landfall theories and working from different clues -- independently arrive at essentially the same population range for San Salvador, the rest of us must sit up and take note. The Diario (Dunn & Kelley 1989) contains two separate statements of Columbus from which the population of San Salvador can be inferred; and unsurprisingly, these statements confirm each other. From this point forward, any theorist who advocates a substantially different number for the indigenous population of San Salvador will have a difficult burden of proof to bear.
Estimates of the pre-Columbian population of the Caribbean vary widely. Population estimates for Hispaniola alone range from 60,000 (Rosenblat 1967) to 8 million (Cook & Borah 1971). Thus the native population for small islands such as the Bahamas are open to wide differences in interpretation. I initially thought that perhaps we could get some ideas by studying the populations of small islands prior to the industrial revolution. It became clear that small islands are capable of supporting very high population densities. But it was also clear that the Caribbean was undergoing a population explosion in the 18th century, driven by immigration from Europe and the African slave trade. And upon further reflection, it seems wholly inappropriate to apply population densities supported by the European urban capitalist economy to the small island subsistence economy of the pre-contact Lucayans.
Undoubtedly a better model can be found in the Pacific, where European influence was far less intense, and where the indigenous peoples had a technology, lifestyle, climate and geography similar to that of the Lucayans. I have collected early population reports from Pacific islands from various sources (Finney 1973; Gorenfield 1994; Hooper 1993; Kennedy 1974; McArthur 1967; McEvedy & Jones 1978; Nordyke 1977; Powell 1960; Schmitt 1968), looking for the earliest reliable estimates or counts in all cases. Unfortunately, many of these islands were ravaged by epidemics before reliable counts could be taken. On the other hand, many of the islands were discovered late enough in history that the discoverers were aware of the importance of accurate population counts or estimates.
I have made an effort, as far as possible, to count individual islands instead of doing group averages. This is because group averaging can be deceiving when the group contains islands of widely differing sizes. For example, Western Samoa has four inhabited islands, two very large ones (Savai'i and Upolu) and two very small ones (Apolima and Manono). Averaging creates four medium-sized islands which retain the lower population densities of the larger pair.
But population estimates for individual islands are not available in many cases (notably Micronesia, the Tuamotus, and many atolls), so I have reluctantly let these group averages stand. There are also some tough calls in determining whether an atoll island counts as one island or more than one. My rule of thumb is that if the water between two pieces of land can be easily waded, it counts as one island, otherwise it's two. I have also excluded any island smaller than 20 hectares from the atoll counts, on the grounds that it would be uninhabitable; and (in the case of Mangareva) excluded islets known to be uninhabited. For atoll groups for which I have no large-scale maps, I have assumed an average of 3 islands per atoll, which is consistent with the mapped atolls.
In the Hawaiian Islands, pre-discovery population estimates range from 200,000 to 300,000 (Schmitt 1968; Nordyke 1977) for the group as a whole, but there are no estimates for individual islands. By the time of the first island-by-island count in 1831-32, the population had dwindled to about 130,000. In order to get the individual island estimates given in the table, I have adopted the same ratios of island populations found in 1831, and estimated the likely 1778 population by multiplying the 1831 counts by a factor of 1.9.
Finding the areas of many of the smaller islands turned out to be more difficult than finding early population estimates (Baldwin 1908; Gorenfield 1994; Hooper 1993; Karolle 1993; Kennedy 1974; Powell 1960; Raratonga Survey, ca. 1965). In some cases (such as the smaller Marquesas), I found large-scale maps which I measured. The island count for Micronesia was derived from Karolle (1993) by counting named islands and atolls in the gazeteer. There are also two island population counts I excluded: Kahoolawe in Hawaii (1778 population estimate: 152, size: 174 km2) and Manuae in the Cooks (1829 population: 10; size: 6.2 km2). In these cases, the island is clearly able to support a larger population than these early estimates. Therefore, these populations could not have been at static levels; they must have been growing or -- more likely -- shrinking rapidly. (And in fact, both of these islands were uninhabited within a few years of their counts.)
Note again the wide variation in population densities. But also notice something odd: even more clearly than in the Caribbean, small islands tend to be more densely populated than large islands. This can be most clearly seen in Samoa, where in 1839 tiny Manono supported a density of over 300 per square kilometer. Remarkably, this density is 14 times greater than that of its much larger neighbor Upolu -- even though the two islands are enclosed by a single reef and separated by only a mile of water. Further, this population estimate was not a mere fluke or error, since the first real count (in 1900) showed that, while the populations of both islands had declined, the smaller island still supported 15 times greater population density than the larger (McArthur 1967). The same trend is apparent throughout Samoa and broadly throughout the Pacific.
To account for this unexpected observation, I first noted that the population of an island tends to grow rapidly until some critical resource is no longer easily available; at which time growth slows until the population and the critical resource achieve a static balance. At this point, the island has reached its carrying capacity. This is the logistical model of population growth, first noted by Pearl (1925), and extended to human populations by Keegan, Johnson, and Earle (1985) and Keegan (1992). I hypothesized that if the critical resource is ocean-based, the size of an island's population should be roughly proportional to the length of its coastline rather than its area. Then too there was the possibility that early population counts by Western mariners were biased in a coastwise fashion: populations may have been estimated by looking only at the people visible along the coast. If this were true, reported populations would also be proportional to coastline length.
To test these hypotheses, I plotted the logarithm of the islands' sizes against the logarithm of the islands' populations (figure 1). If population density did not change as area increased, we would expect that the data points on such a log-log plot would be linear, highly correlated, and have a regression slope of 1. But if the population varied according to the length of the coastline, we would expect that the data points would be linear, highly correlated, and have a regression slope of 0.5. When I actually plotted the data, I found that the data points were linear, highly correlated (r2 = .866), and had a regression slope of 0.726. This shows clearly that the increase in population density with decreasing island area is a real phenomenon, but it does not support the idea that island populations vary according to coastline length.
 |
| Fig. 1. Graph of population vs. island size |
|---|
It is not immediately obvious why island populations should vary in such an manner. Nor is it clear why this relationship should hold for such a broad range of island sizes, from 1 to over 10,000 km2. It is logical to suppose that there is an interplay among fishing, cultivation, and the capacity of the island's aquifer; and that this interplay, along with socioeconomic factors, determines an island's carrying capacity. This in turn implies that the underlying population-area function may be polynomial rather than logarithmic. For example, if the mean coastline length of a Pacific island were found to be L = 4.5 √a, and if the interior portion of a Pacific island supported 9 persons per km2 (from cultivation and forage), and the coastal region supported 26 persons per linear km. of coastline (from fishing), the resulting population vs. area function would be close to the regression line seen in the data within one-sigma limits, provided the function is applied over the same range of island sizes. The actual description of any such theoretical function and its defense in real-world terms is beyond the scope of this paper.
One quite useful result that can be gained from the Pacific data is a formula for determining the likely pre-contact or early post-contact population ranges for any inhabited Pacific Island (or the carrying capacity of an uninhabited island), provided we know its size. Applying the linear regression in figure 1 yields the relation:
P = k a0.726 (1)When the island area a is measured in square kilometers, use equation (1) to find the mean expected population P and one-sigma (i.e., one standard deviation) limits, by taking the following values for k: for the mean population, k = 96; for the upper limit, k = 202; and for the lower limit, k = 45. We can use a similar formula for determining the population density range for an island:
D = k a-0.274 (2)Expected population density D per square kilometer and one-sigma limits can be found from equation (2), using the same values for k given above.
Naturally we wish to know: does this relationship between island size and population hold for the pre-discovery Caribbean islands? Given the wide uncertainty in population estimates for the area, it is difficult to say with certainty. But there are some tantalizing clues.
The Pigeon Creek region on the southeast coast of Watlings Island has been the subject of a number of archeological investigations in this century, most recently Rose (1982) and Rose (1987). Craton and Saunders (1992) report that the main settlement and its nearby satellite sites could plausibly hold a population in the range of 500 to 1000. But what fraction of the island's population does this represent? It is reasonable to assume that the forage and cultivation range for these sites covered roughly the southeastern quarter of the island: south of Granny Lake, east of Great Lake, and north of Montreal. This region is defined by three natural choke points which would make convenient boundaries with other population areas on the island. The land area within these choke points is about 23 km2. Since the total land area of Watlings is 101 km2 (the official value of 163 includes the large inland lakes), this implies a total island population of about 4.4 times the Pigeon Creek population, or 2200 to 4400. On the other hand, Craton and Saunders (1992) have speculated that the Pigeon Creek population could represent as much as half of the island's total population, which implies a total of 1000 to 2000.
If we take an intermediate value for the population of Pigeon Creek (750), and an intermediate value for the multiplier (3), this would give us a total population of 2250, with a range of 1000 to 4400. [And a density range of 10 to 44, with 22 as an intermediate figure. These densities are far higher than the 4 per km2 accepted by Keegan (1992) and Kelley (1992) as a model; but they were adopting the minimum value of Johnson and Earle (1987), which Keegan (1992) was careful to note as a falsifiable assumption.] The Pacific model predicts that an island the size of Watlings should have a population of 2700, with a range of 1300 to 5700. In general this suggests that the Pacific model is an acceptable population predictor for a Bahamian island the size of Watlings, and specifically that it is more useful than the 4 per km2 minimum of Johnson and Earle (1987).
As mentioned above, the population of Hispaniola has been the subject of wide debate. Keegan (1992) reports that one of the best recent estimates has been made by Samuel Wilson in 1990, who extrapolated from the Spanish censuses of 1508 and 1514 to estimate a total pre-contact population of 380,000 for the island. Keegan (1992) has suggested a population of 302,000 by applying the 4 per km2 minimum density of Johnson & Earle (1987) to the island. The Pacific model predicts that an island the size of Hispaniola would have a population of 330,000 within a range of 160,000 to 700,000. Extrapolating the Pacific model to islands so far outside its verifiable limits of island size should be viewed with some skepticism, but this does again suggest that the model is an acceptable predictor in the Caribbean, even outside those limits. It also suggests a useful maximum size for which the model is valid: when the predicted density falls below 4, the island has reached essentially continental size for a subsistence economy under the regional polity economic structure of Johnson and Earle (1987). This occurs when the island is about 100,000 km2, or roughly the size of Cuba.
There are several important consequences of this model when applied to the Caribbean. First, archeological surveys in the Caribbean have usually been confined to the coastal areas. The model suggests that inland surveys may be appropriate on the larger islands of the Greater Antilles, and perhaps even Andros in the Bahamas. Also, windward as well as leeward coastal areas should be searched. It seems plausible that the predominance of leeward sites in the Bahamas may be due (at least in part) to the more severe actions of weathering on the windward sides of the islands.
More importantly, the model gives us a handle on one of the more vexing questions in historical demography: the pre-contact population of the Caribbean. Since the model seems to work well with Caribbean islands both large and small, we can have some confidence in applying the model to the Caribbean as a whole. Table 3 lists the Caribbean islands, along with model predictions of their likely populations. Although the model's limits are broad for any given island, it is hoped that this model will focus the range of debate more narrowly than in the past.
The model assumes that at the time of European contact, each island had reached its carrying capacity under a subsistence economy. Since the Bahamas were settled late, and in a south-to-north fashion, Keegan (1992) has suggested on the basis of archeological evidence that islands in the northern Bahamas would not have reached this level at the time of contact. Therefore, the population of the northern Bahamas could well have been lower than model predictions. To reflect this, I have arbitrarily reduced the populations for islands north and west of Cat Island by half, and of Abaco and Grand Bahama by two-thirds. This reduces the likely pre-contact Bahamian population total to around 140,000, which (considering the effects of disease) is consistent with the report by Peter Martyr that the Spanish depopulated the islands by taking 40,000 slaves from there in the period 1509-1513.
The final consequence of this model is that we can get some idea of the likely populations of first landfall candidates by knowing their size; and in turn, the likely size of Columbus's landfall island by knowing its population. I have plotted the model predictions for the populations of some landfall candidates in figure 2. The hatched areas in the figure represent the Kelley (1992) minimum population and the Perez (1995) maximum population for San Salvador.
If we assume that the population of the islands had reached carrying capacity at the time of discovery (which may not have been true in the northern Bahamas, but likely was true in our area of interest), the model predicts that to fall within the expected San Salvador population range of 634 to 1000, the size of single-island San Salvador would most likely be in the range of 13 to 25 km2, with one-sigma limits of 5 to 71 km2. These ranges are a little lower for a multiple-island San Salvador. Counting only dry-land areas, Conception is 3.7, Grand Turk is 15, the Plana Cays are 16, Samana Cay is 39, and Watlings is 101.
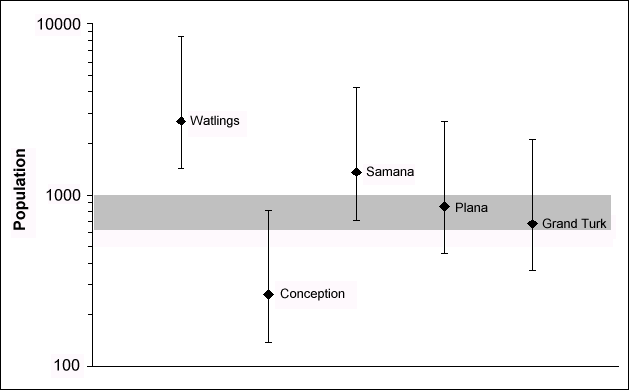
Fig 2. Pre-contact population of landfall candidates estimated from equation 1.
Likely population of Guanahani is shown in gray.
Considering the uncertainties inherent in a model of this kind, it would be overstating the case to claim that any islands, even those as small as Conception or as large as Watlings, should be eliminated from consideration on the basis of population alone. However, we can say that on the basis of population alone that the Plana Cays and Grand Turk have the strongest case for being Columbus's first landfall. Pickering (1994) has shown that on the basis of the inter-island track, the Plana Cays also have the strongest case for being San Salvador. Columbian scholars, whether advocates or agnostics on the landfall issue, would be well advised to take population into account when giving landfall candidates an unbiased examination.
![]()
| Previous clue | Next
clue |
Return to the landfall clues page.